RationaleWhile mapping existing infrastructure can give us an idea of physical access to public transportation, we felt as though it was not sufficient to simply determine access. For example, a ¼ mile buffer around Caltrain stations shows the pedestrian shed of the infrastructure and that it is physically accessible by walking for the overlapping geographies. Further, the ADA demarcation shows that those with physical disabilities can access rail transit at specific stations. However, these inferences fail to incorporate other factors influencing access such as convenience, time, and demand. Even if a Caltrain station is within walking distance or ADA accessible, long wait times may deter an individual from using the service. This is why an insight on non-physical barriers in addition to the physical accessibility of infrastructure is essential to understanding where improvements are best directed. Our methodology aims to bridge this gap, in response to the Grand Jury report’s methodology which only looked at wait times resulting from asynchronous SamTrans and Caltrain schedules. By showing the spatial distribution of access barriers, we can extrapolate which areas demand the most attention from transit agencies engaging in planning and schedule upgrades. LimitationSHowever, quantitative data can also only tell us so much. While a ¼ mile buffer is the rule of thumb for estimating the pedestrian shed of a station, it does not consider the availability or quality of the surrounding street network. Each person’s demand for public transportation and access issues they face are unique, so it would have been beneficial to go out into the field and collect qualitative data through interviews and stories about what barriers people face daily. Many times, the desire to drive versus use public transit is a matter of convenience or lack of trust in the reliability of the existing public transportation infrastructure, and this can be difficult to measure quantitatively without gathering survey data.
|
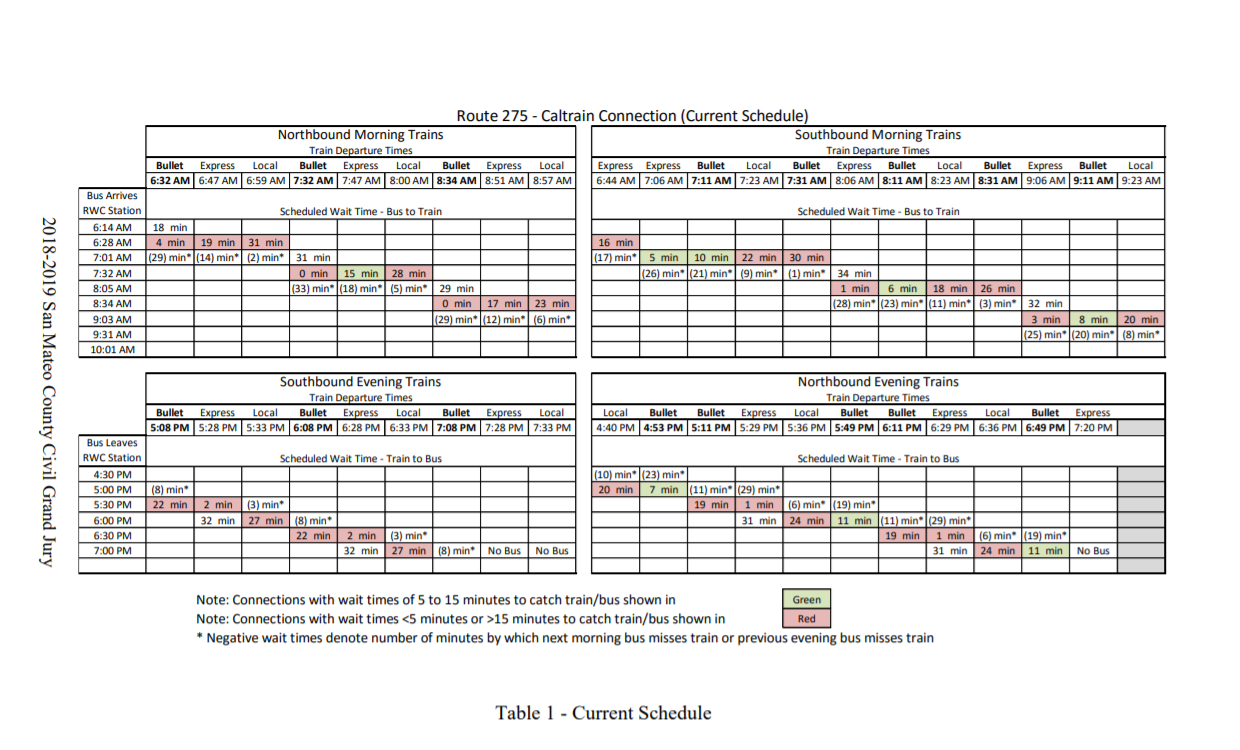
Analysis of the existing transfer times from SamTrans Line 275 were done by the Grand Jury as an example of the scheduling discontinuities. Our team decided to take the analysis one step further and investigate all of the "Caltrain Connector" routes.
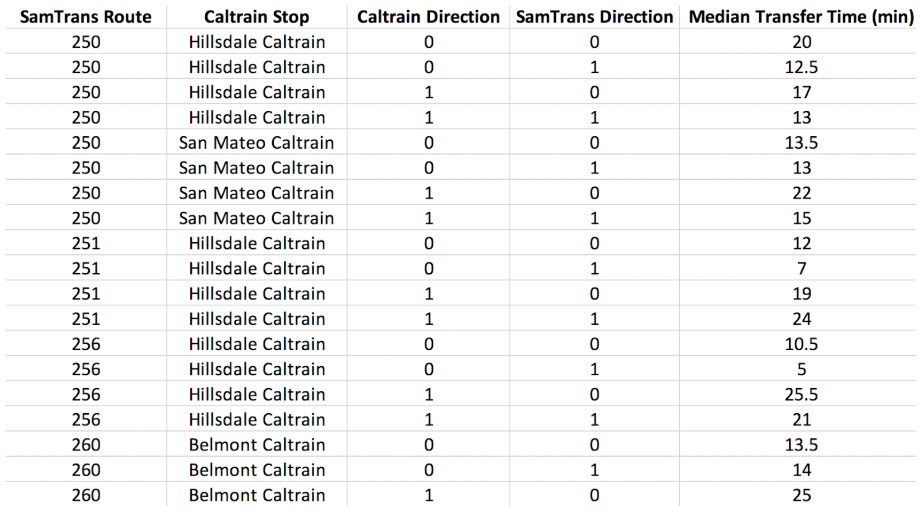
A brief look into our scheduling analysis of each "Caltrain Connector" route and its corresponding Caltrain Station. The median transfer time between each route and the next Caltrain to arrive is displayed on the right column. Our more detailed data shows differences in time of day as well as direction.
|
